Climate
Corner
|
Household Impact
What happens to the family budget once we implement Carbon
Fee and Dividend? We know that
greenhouse gas emissions will be reduced to levels that will provide for a
stable climate, that the economy will grow, more jobs will be created, and
lives will be saved by reduced pollution.
But, let's get practical - before Congress votes for our bill, they want
to be assured that households will benefit.
Citizens' Climate Lobby commissioned Kevin Ummel, Research Scholar at Energy Program
International Institute for
Applied Systems Analysis to evaluate the net financial impact of Carbon Fee and
Dividend on households. The results are now available for public consumption. You can click here for the whole 40 page study or a 2
page summary.
National and Local Impacts
Closer to home, we want to know
the effect on household income here in our Congressional District. FL-District 17 includes all or parts of 9
counties (Polk, Sarasota, Charlotte, Hardee, Highlands, Desoto,
Okeechobee, Glades and Lee). Here is
what the Ummel study tells us in general:
·
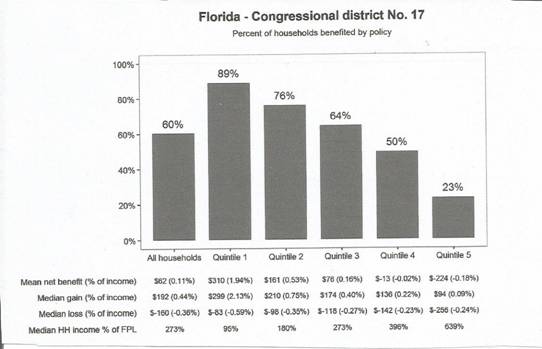
60 percent of households in our
district will see a net benefit from CF&D. By "benefit" we mean
the dividend payments the households receive will be more than the increased
cost of products as a result of the fee on carbon. Look at the left hand bar on the chart on the
next page to see graphically what this 60 percent benefit looks like for
"all households."
Next, let's break down benefits by income. In the graph you can see households
broken down by income in 5 categories, with Quintile 1 being the lowest 1/5 of
income earners and Quintile 5 being the highest 1/5 of income earners.
·
The average
benefit or loss for a group is called Mean Net Benefit (% of income).
For example, in Quintile 1, the average benefit is $310 a year, and this
constitutes 1.94% of the income of those households (HH).
·
Median Gain
(% of income): This figure is only for
those households that show a net gain. So in Quintile 1, 89% of the Quintile
shows a net gain, and the median gain for
that 89% is $299 or 2.13% of income.
The Median Net Gain then represents the gain for a HH in the middle of
this group - the "typical" HH.
Note: The mean can be higher (as it is in this case) or lower
than the median.
Figure 1-FL District 17 Household Impact by Income
·
Median Loss
(% of income): This figure is only for those households that
show a net loss. The median loss here
for Quintile 1 of $83 (0.59% of income) is much less than the median gain, in
part because the quintile as a whole does well.
In contrast, in Quintile 5, the median loss is much greater than the
median gain as overall the quintile loses. The "typical" Quintile 5 HH will lose $256 annually, which
is .24% of their income - a small amount in relative terms. So, Quintile 5 incurs the most cost because
they have the most money and buy the most stuff (much of one's carbon footprint
comes from stuff one bys).
·
Median HH
Income % of FPL: FPL is
the Federal Poverty Level, and is currently $24,250 for a family of four (2016-Poverty-Level-Chart) and $11,770 for a family of one. This figure tells you how the typical HH
income of this quintile compares to the federal poverty level. For Quintile 1 the value is 95%, meaning that
half of these households make less than 95% the federal poverty line and half
make more. In quintile 5, half the
households make less than 639% the federal poverty line and half make
more. To translate this to real money-
the "typical" Quintile 1 HH in FL-17 earns about $23,000 annually,
while the "typical" Quintile 5 HH has an income of about $156,000.
The Ummel report also includes
Violin Graphs, which depict similar information as the bar chart. The Violins
provide additional insight in the form of a visual picture.
Figure 2- Violin Graph of Benefit by Income, FL 17
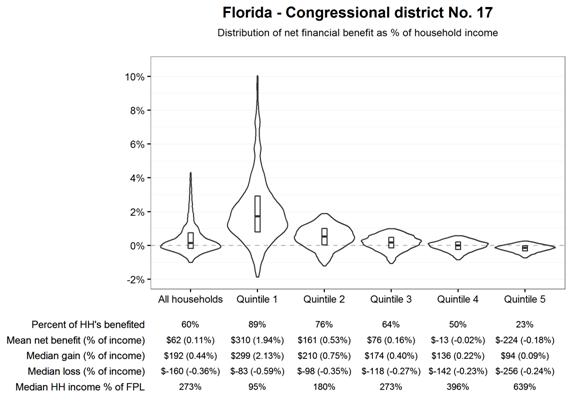
You can see in this Violin chart,
the Mean Net Benefit (% of income), Median Gain (% of income), Mean Loss (% of
income), and Median HH Income % of FPL are defined exactly as above for the bar
chart. The shape itself provides
information on how many households benefit at different levels of benefit (or
loss).For Quintile 1, you can see that most households gain about 1-3% of their
income, but a few people gain as much as 10%. A few households in this quintile (11%) show loses but none more
than 2% of their income. As an aside, the bars within the violin represent 1)
75th percentile
of the distribution (top of bar), 2) 25th percentile (bottom of bar) and 3) median (line
in middle of bar).
The Violin helps us see the bottom
Line: the distribution of those incurring net cost (below 0%) is very small
indeed.
In
addition to income, the study evaluates impact by age groups, household type (elderly,
family of four, low income, minority and poverty), and ethnic group. These
breakdowns can be seen in the detailed report
for FL-17.
The main lessons we take from the Household
Impact report are
·
The most vulnerable generally do well
·
Some folks do not do well, but their loss is small, and reducing
footprint can result in net gain
·
Those disadvantaged are those most able to afford it, and their net loss
is very small
·
This analysis is limited to household financial impact only and it does
not Include the tremendous
health, climate, and general environmental benefits provided by CF&D
Overall, there is nothing to fear from Carbon Fee and Dividend in Florida
Congressional District 17. To the contrary, the net impact on Household income is
beneficial. CF&D makes most folks here whole. A small percentage come our
slightly behind, and they could become net benefiters if they change their
energy use or other things they buy.
|
Next
in the Climate
Corner - Macro economics,
and the REMI* Study Previous postings in the Climate Corner : *Regional Economics
Modeling, Inc. |